
UPDATE: Modeling COVID-19 in Silicon Valley after 4 weeks of shelter-in-place order
This is an UPDATE of my article “Modeling Coronavirus in Silicon Valley” from March 23, 2020.
Photo by CDC
April 7 is the day when people could have returned to normal life. It is the last day of the first shelter-in-place order in Santa Clara County before it was extended till May 3. So where do we stand now? Is the new deadline also ephemeral? Let’s look at data to answer these questions.
In my previous article on COVID-19 in Silicon Valley, I assumed the exponential growth and created a simple model with 3 scenarios - when coronavirus cases double every 6, 7 or 8 days.
Two weeks later I can now say that the true cases stay within the modeling scenarios.
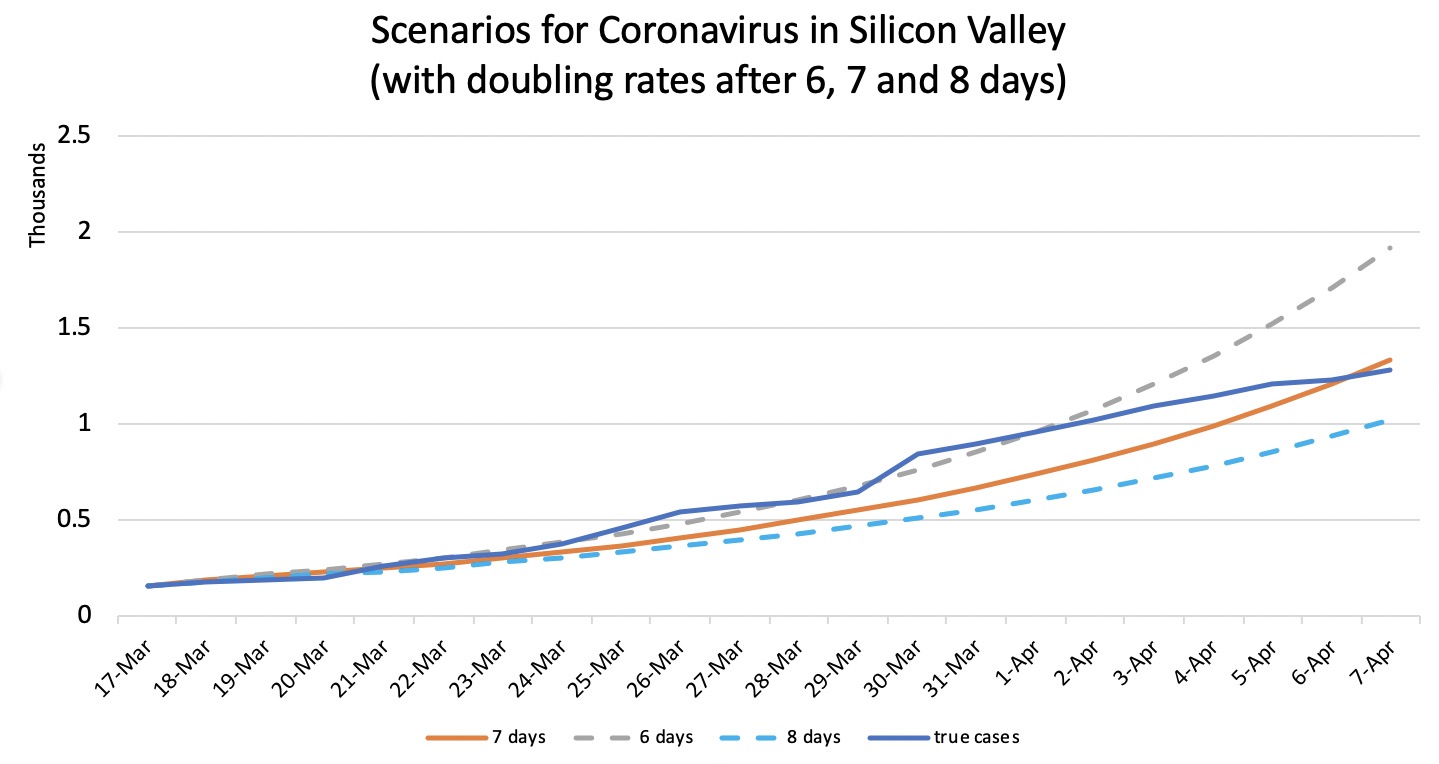
Source: Own modeling based on data from the County of Santa Clara Public Health Department.
From the plot above, we can see that the spread rate in Santa Clara County accelerated in the last week of March (true cases closer to 6 days doubling rate model) and then slowed down starting in April (true cases closer to 7 days doubling rate model).
The slower spread rate indicates that social distancing works.
So what to expect in May? Well, I think the worst time is still ahead of us. If nothing changes, the number of coronavirus cases in Santa Clara County could variate between 17,000 and 38,000 by May 3 or reach 10,000 in the best case (see model here). With such numbers it is hard to imagine the return to normal life in four weeks.
But even if I am wrong (and I hope so!), the simulations done by a popular math blogger 3Blue1Brown show that not isolating all cases might lead to the second wave. So we need effective disease control - testing, quarantine & medical treatment - combined with social distancing.
Until a vaccine against coronavirus is invented, we have to face the new reality and practice social distancing in earnest.

Leave a comment