
Modeling COVID-19 in Silicon Valley

Photo by CDC
A simple model of coronavirus spread in Silicon Valley shows that practicing social distance might help in slowing the spread of coronavirus. But if the growth rate doesn’t change, then in May we will face a critical situation similar to Italy in March.
On March 16, 2020 Santa Clara County - home to Silicon Valley and to almost 2 mln people - issued a ‘shelter-in-place’ order in attempt to slow the spread of Coronavirus.
I’ve been collecting data on Coronavirus cases in Santa Clara County for a week now. We had 155 cases when the order was declared. This number doubled a week later - 302 cases on March 22.
COVID-19 Cases in Santa Clara County
| Time | Total Confirmed Cases | Hospitalized | Deaths |
|---|---|---|---|
| 16-Mar | 155 | 56 | 4 |
| 17-Mar | 175 | 56 | 6 |
| 18-Mar | 189 | 62 | 6 |
| 19-Mar | 196 | 65 | 8 |
| 20-Mar | 263 | 93 | 8 |
| 22-Mar | 302 | 108 | 10 |
Source: Own compilation based on data provided by the County of Santa Clara Public Health Department
Assuming exponential growth, we can model the coronavirus spread as following:
\[ y(t) = y_0 e^{kt} \]
where
\(y_0\) - the number of cases on March 16
\(y\) - the number of cases after certain time period (\(t\)) in days
\(k\) - continuous growth rate
Based on this, we can model 3 scenarios:
- if COVID-19 cases double each week (as now)
- if cases double faster - each 6 days
- if cases double slower - each 8 days
Here are my results:
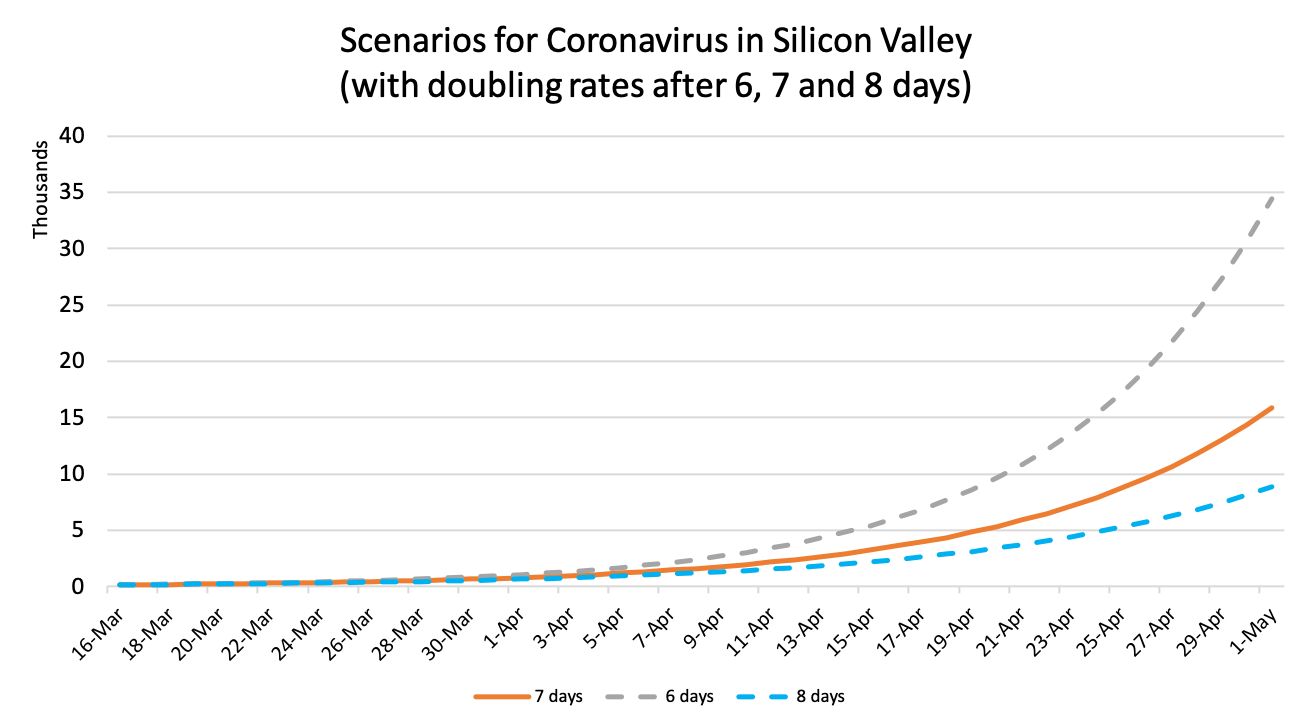
In reality, the numbers above will be different. Still, they give us a feeling of how things might go. If nothing changes, we might expect that situation will be pretty bad around May in Silicon Valley.
However, as with any exponential growth, even change of one day in spreading speed makes a big difference. So practicing social distance should help.
Stay healthy!

Leave a comment